The workspace for compute desks


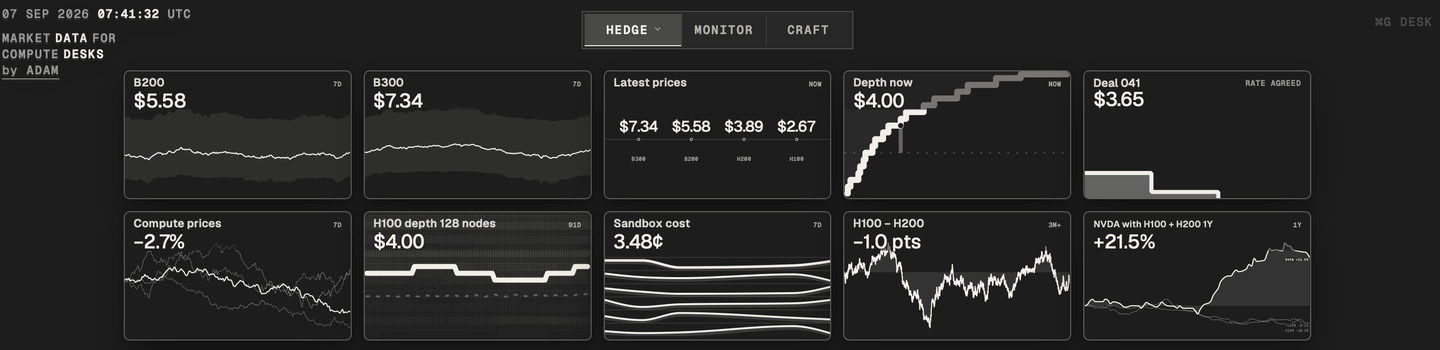
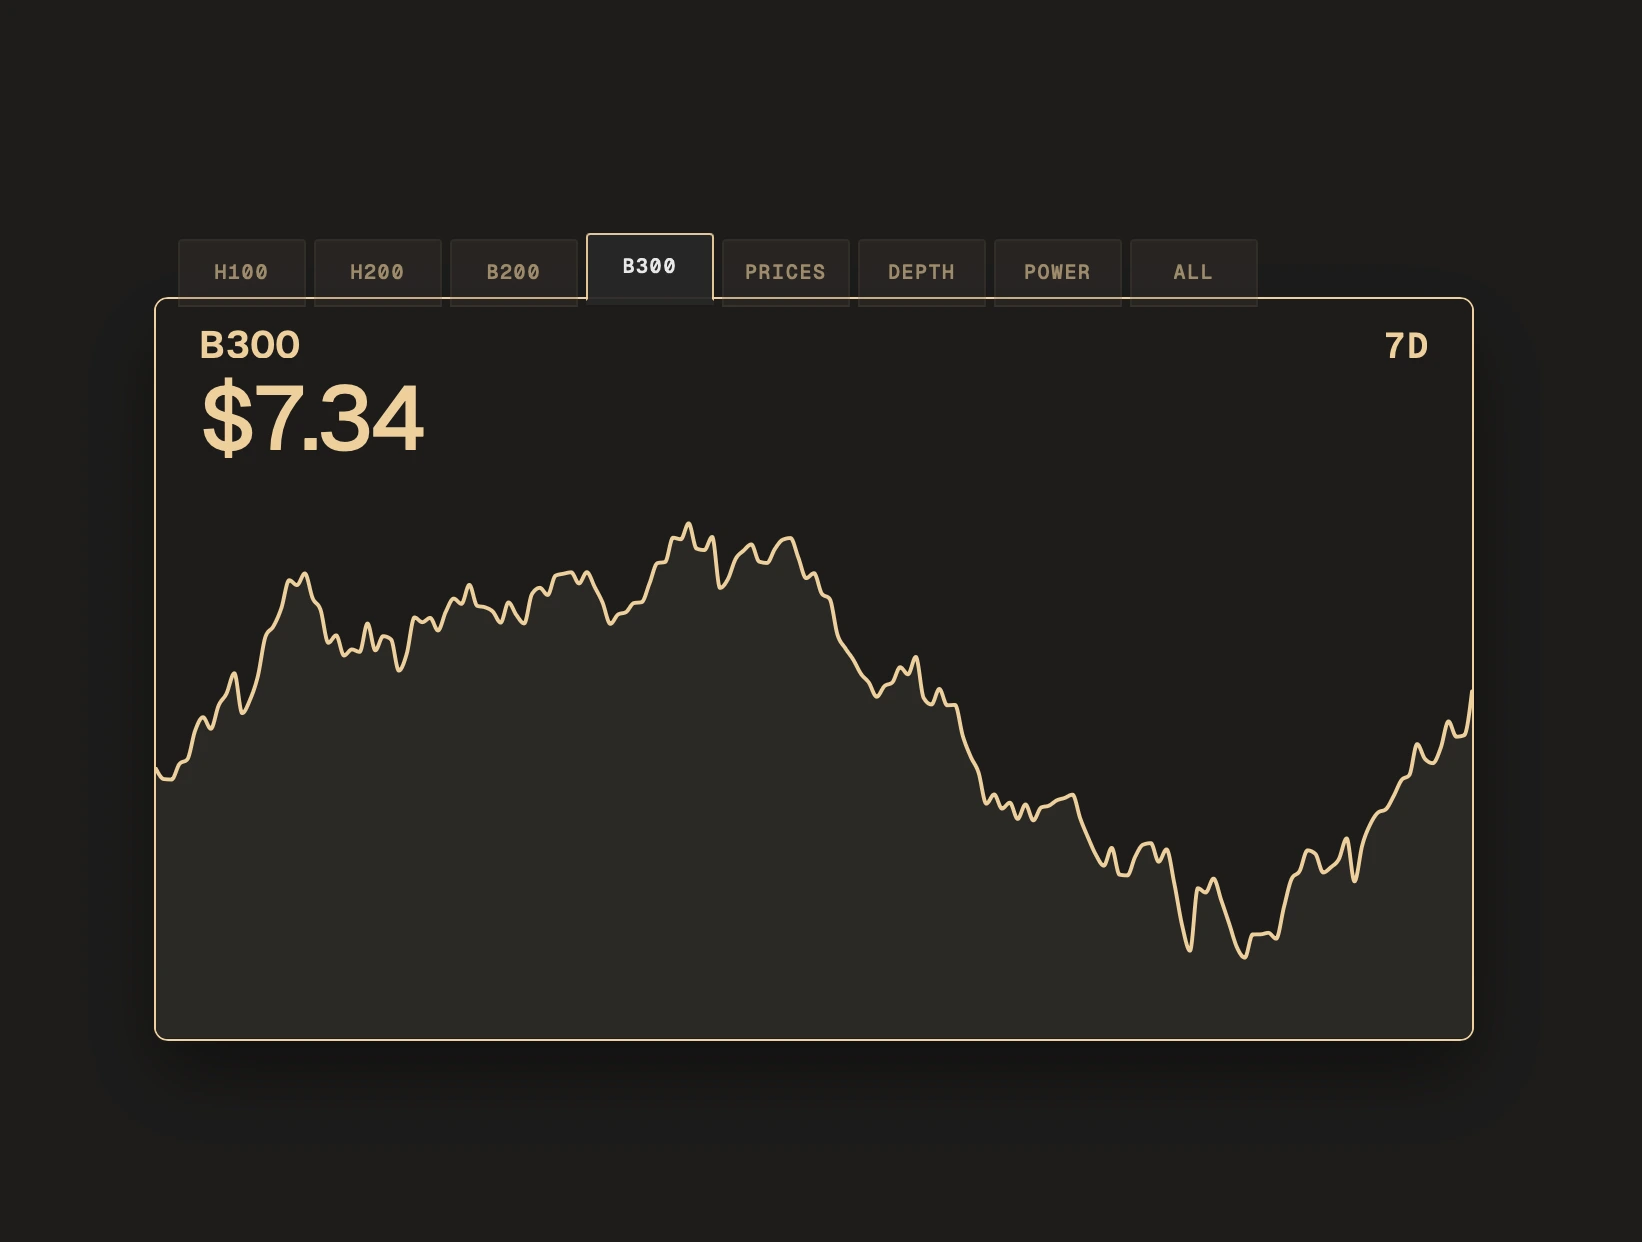
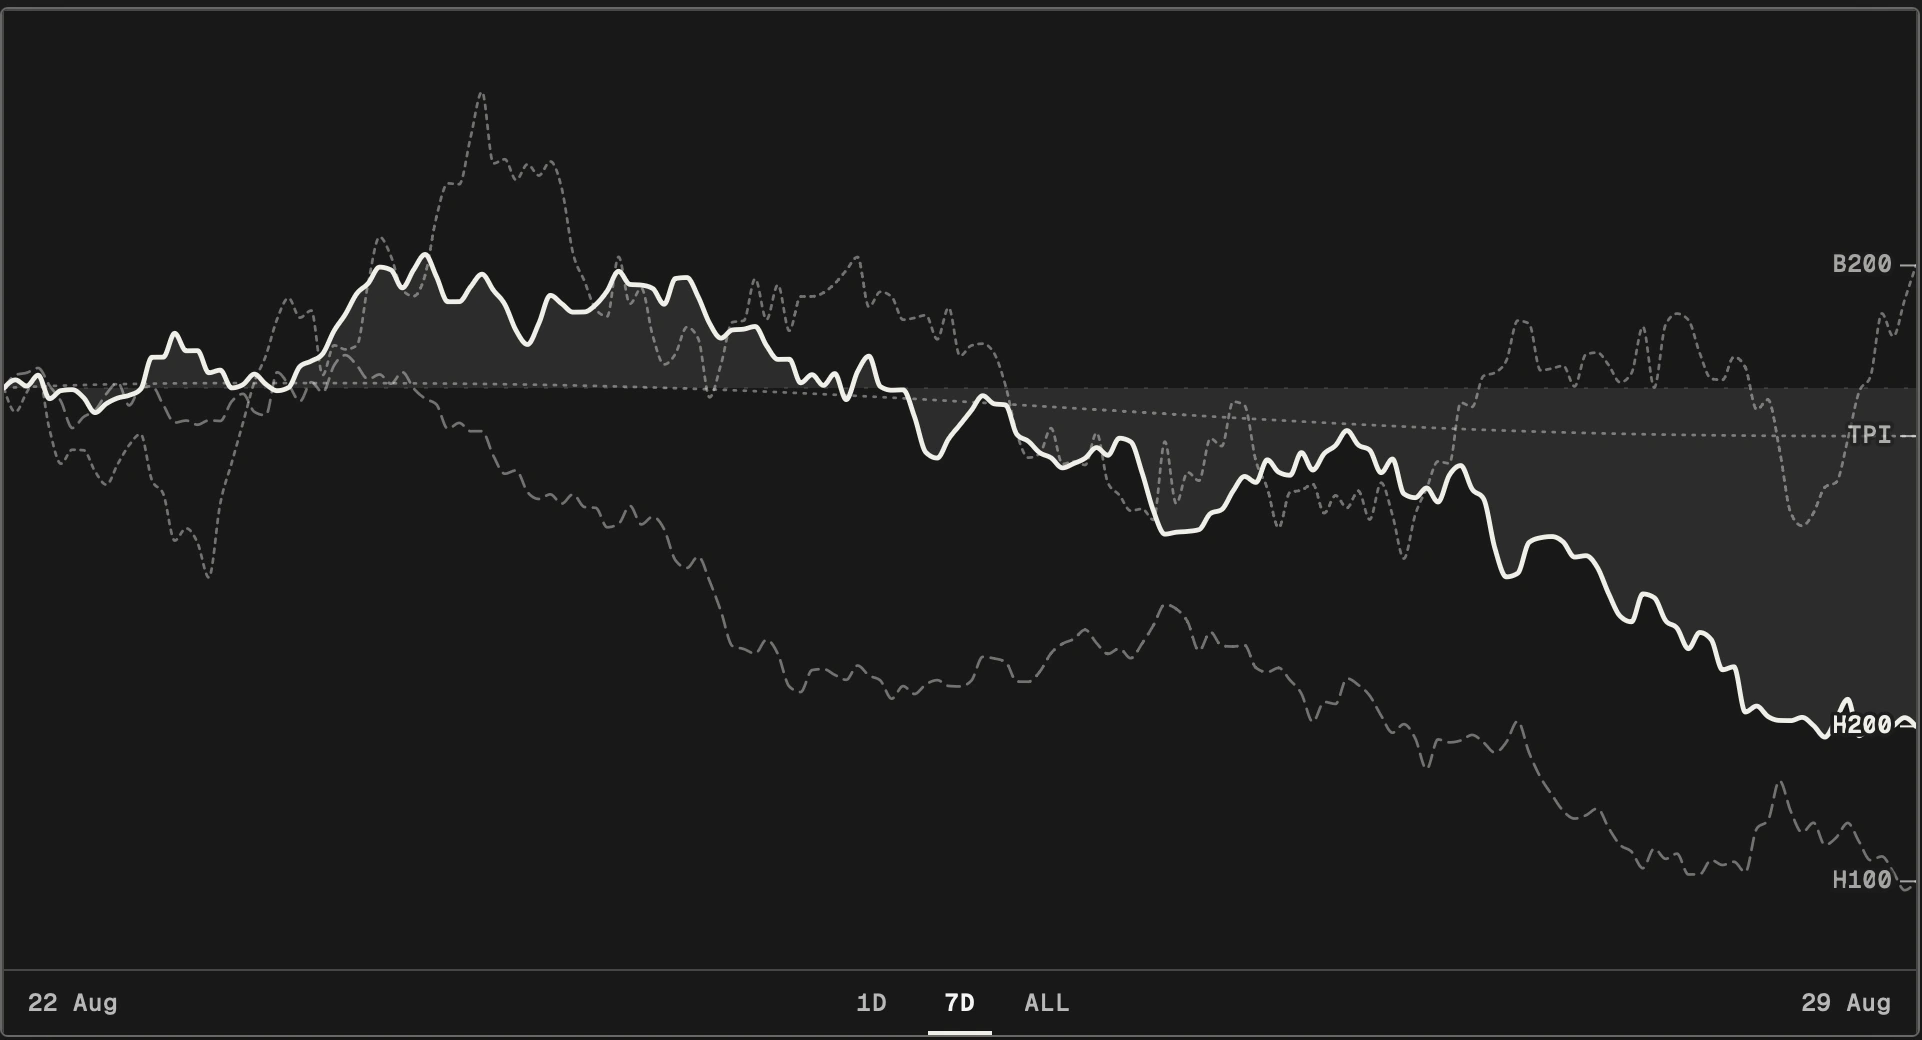
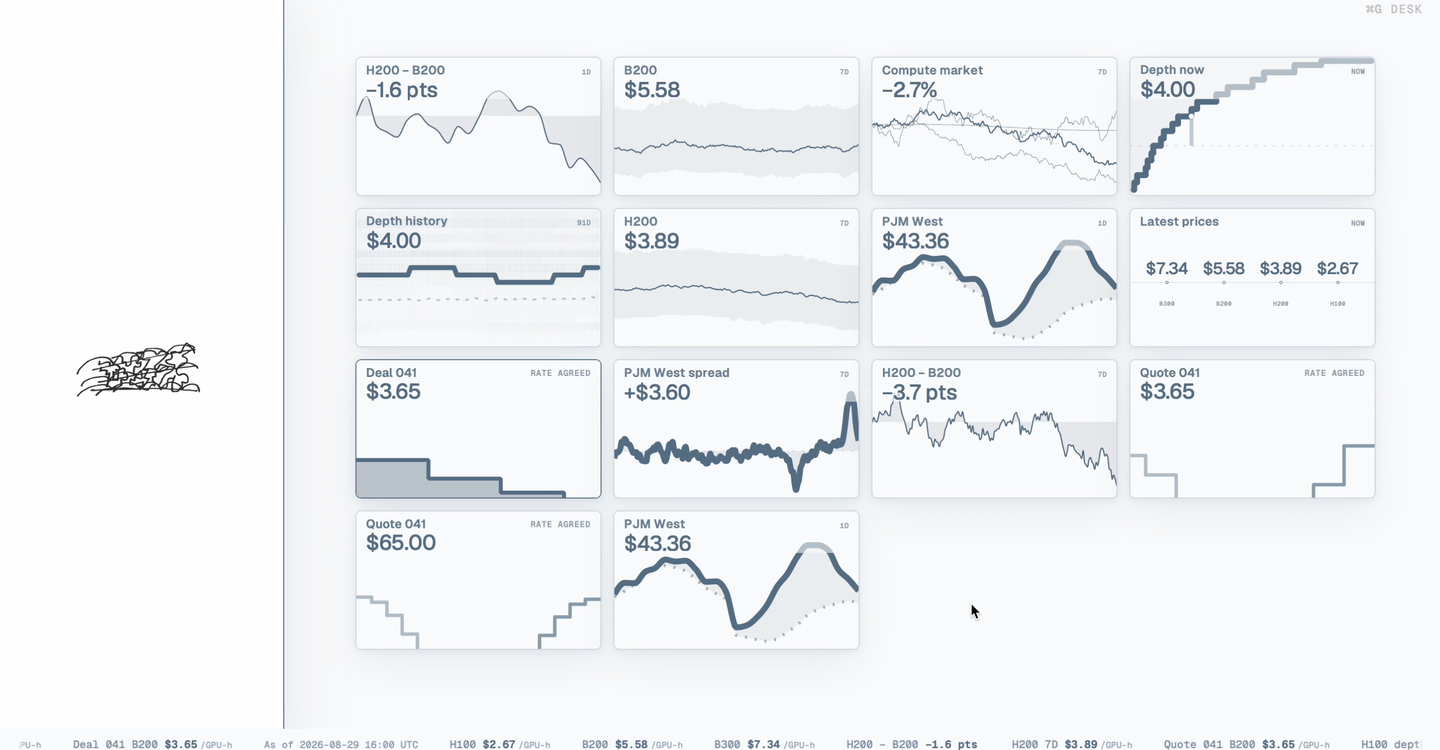
Desk is a workspace for exploring compute market data and creating, monitoring, and sharing market views. It is built for anyone building or running a compute desk.
The work starts with a question about compute. Explore it in a notebook, develop the model, then make the calculation available through a backend. Bring the result into Desk as a view people can follow and share. That is the path I am building toward.
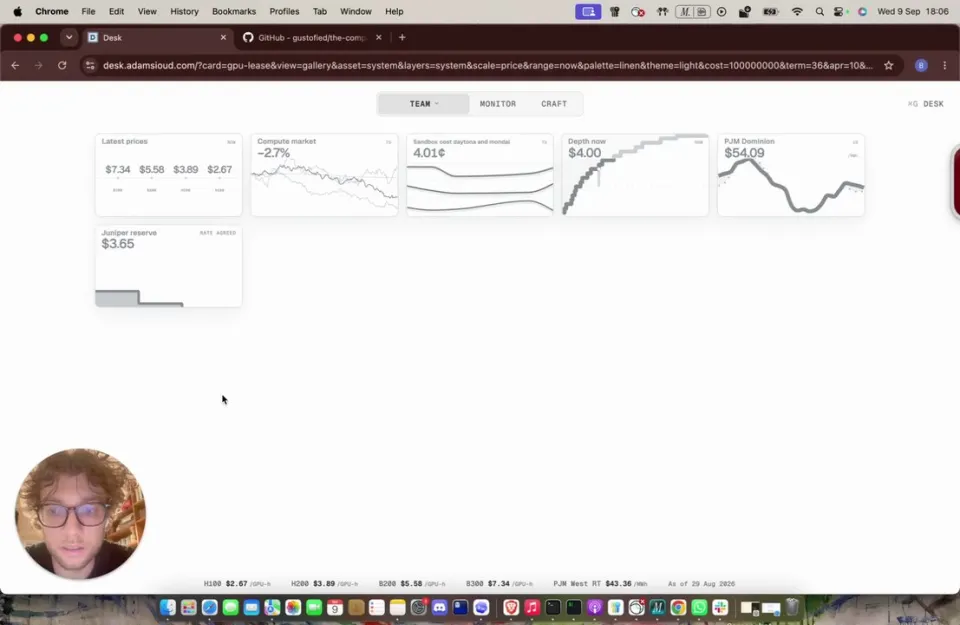 See Desk in action
Open in Loom
The desk
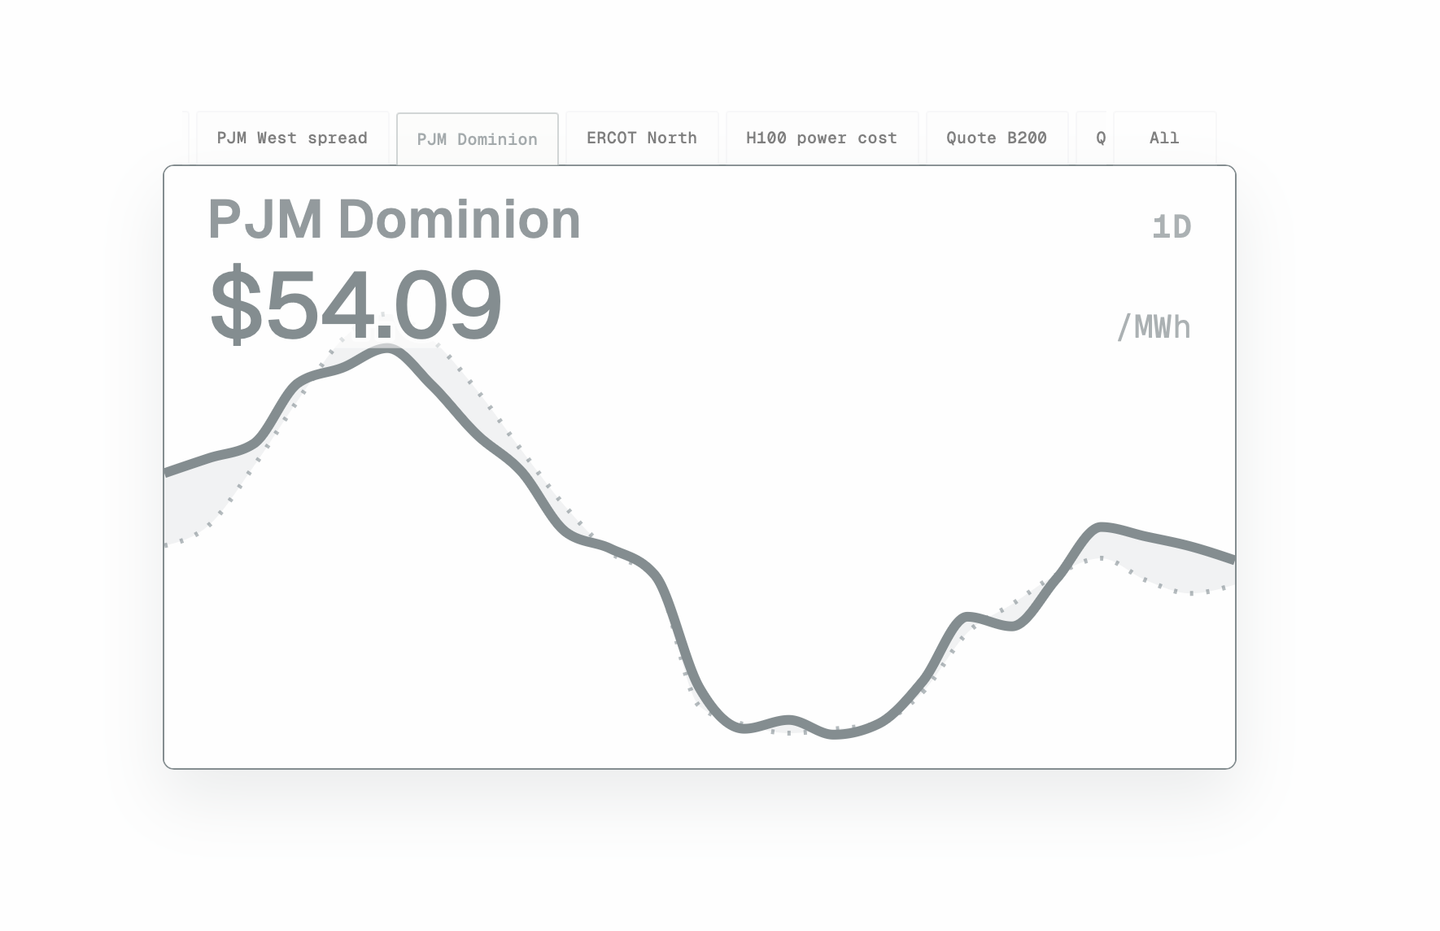
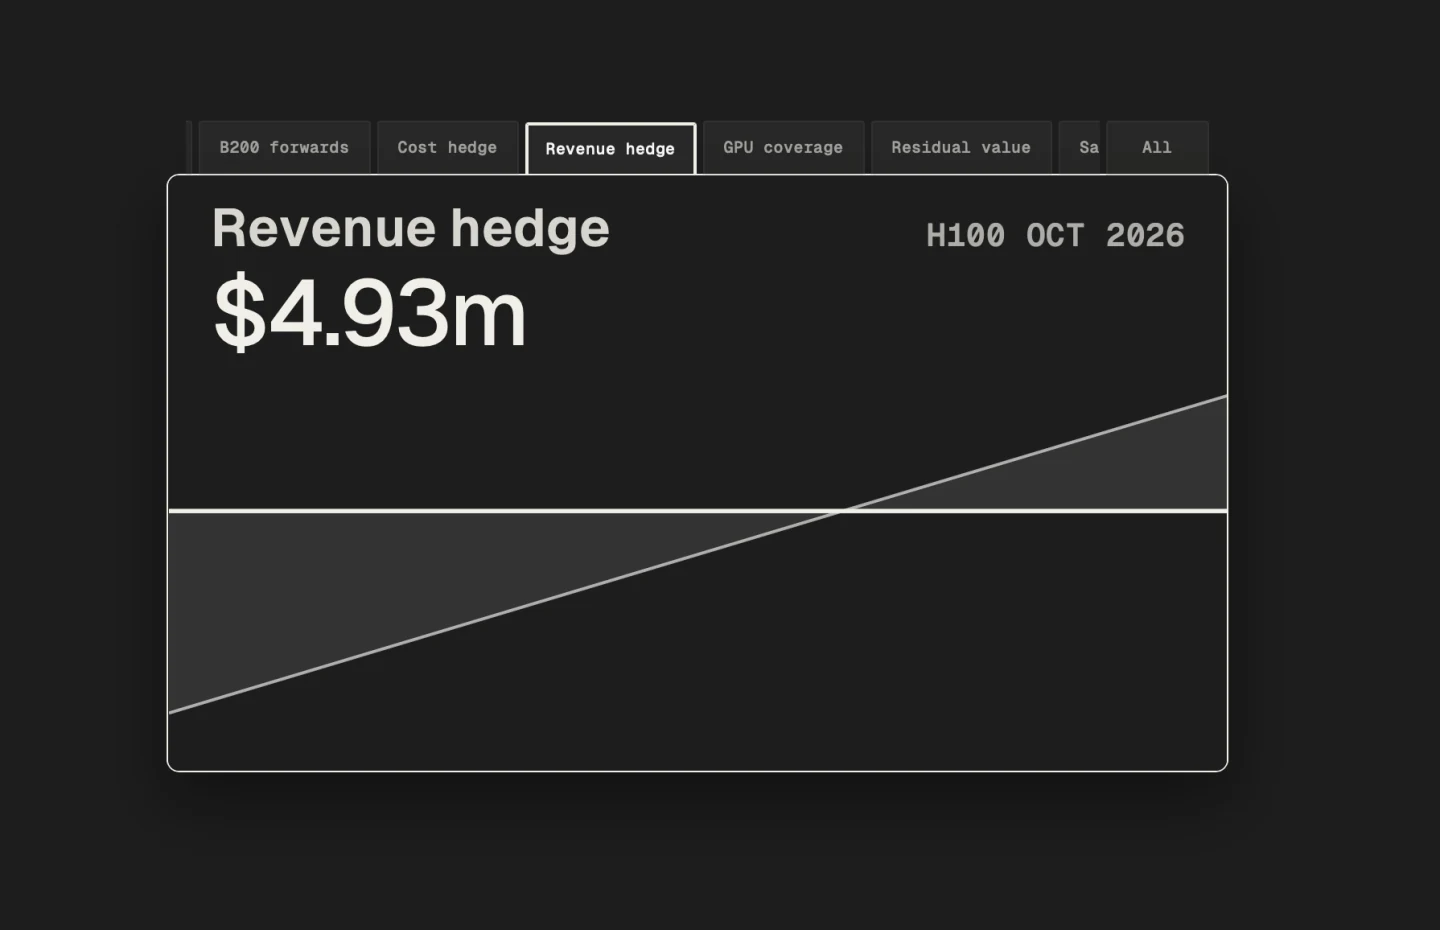
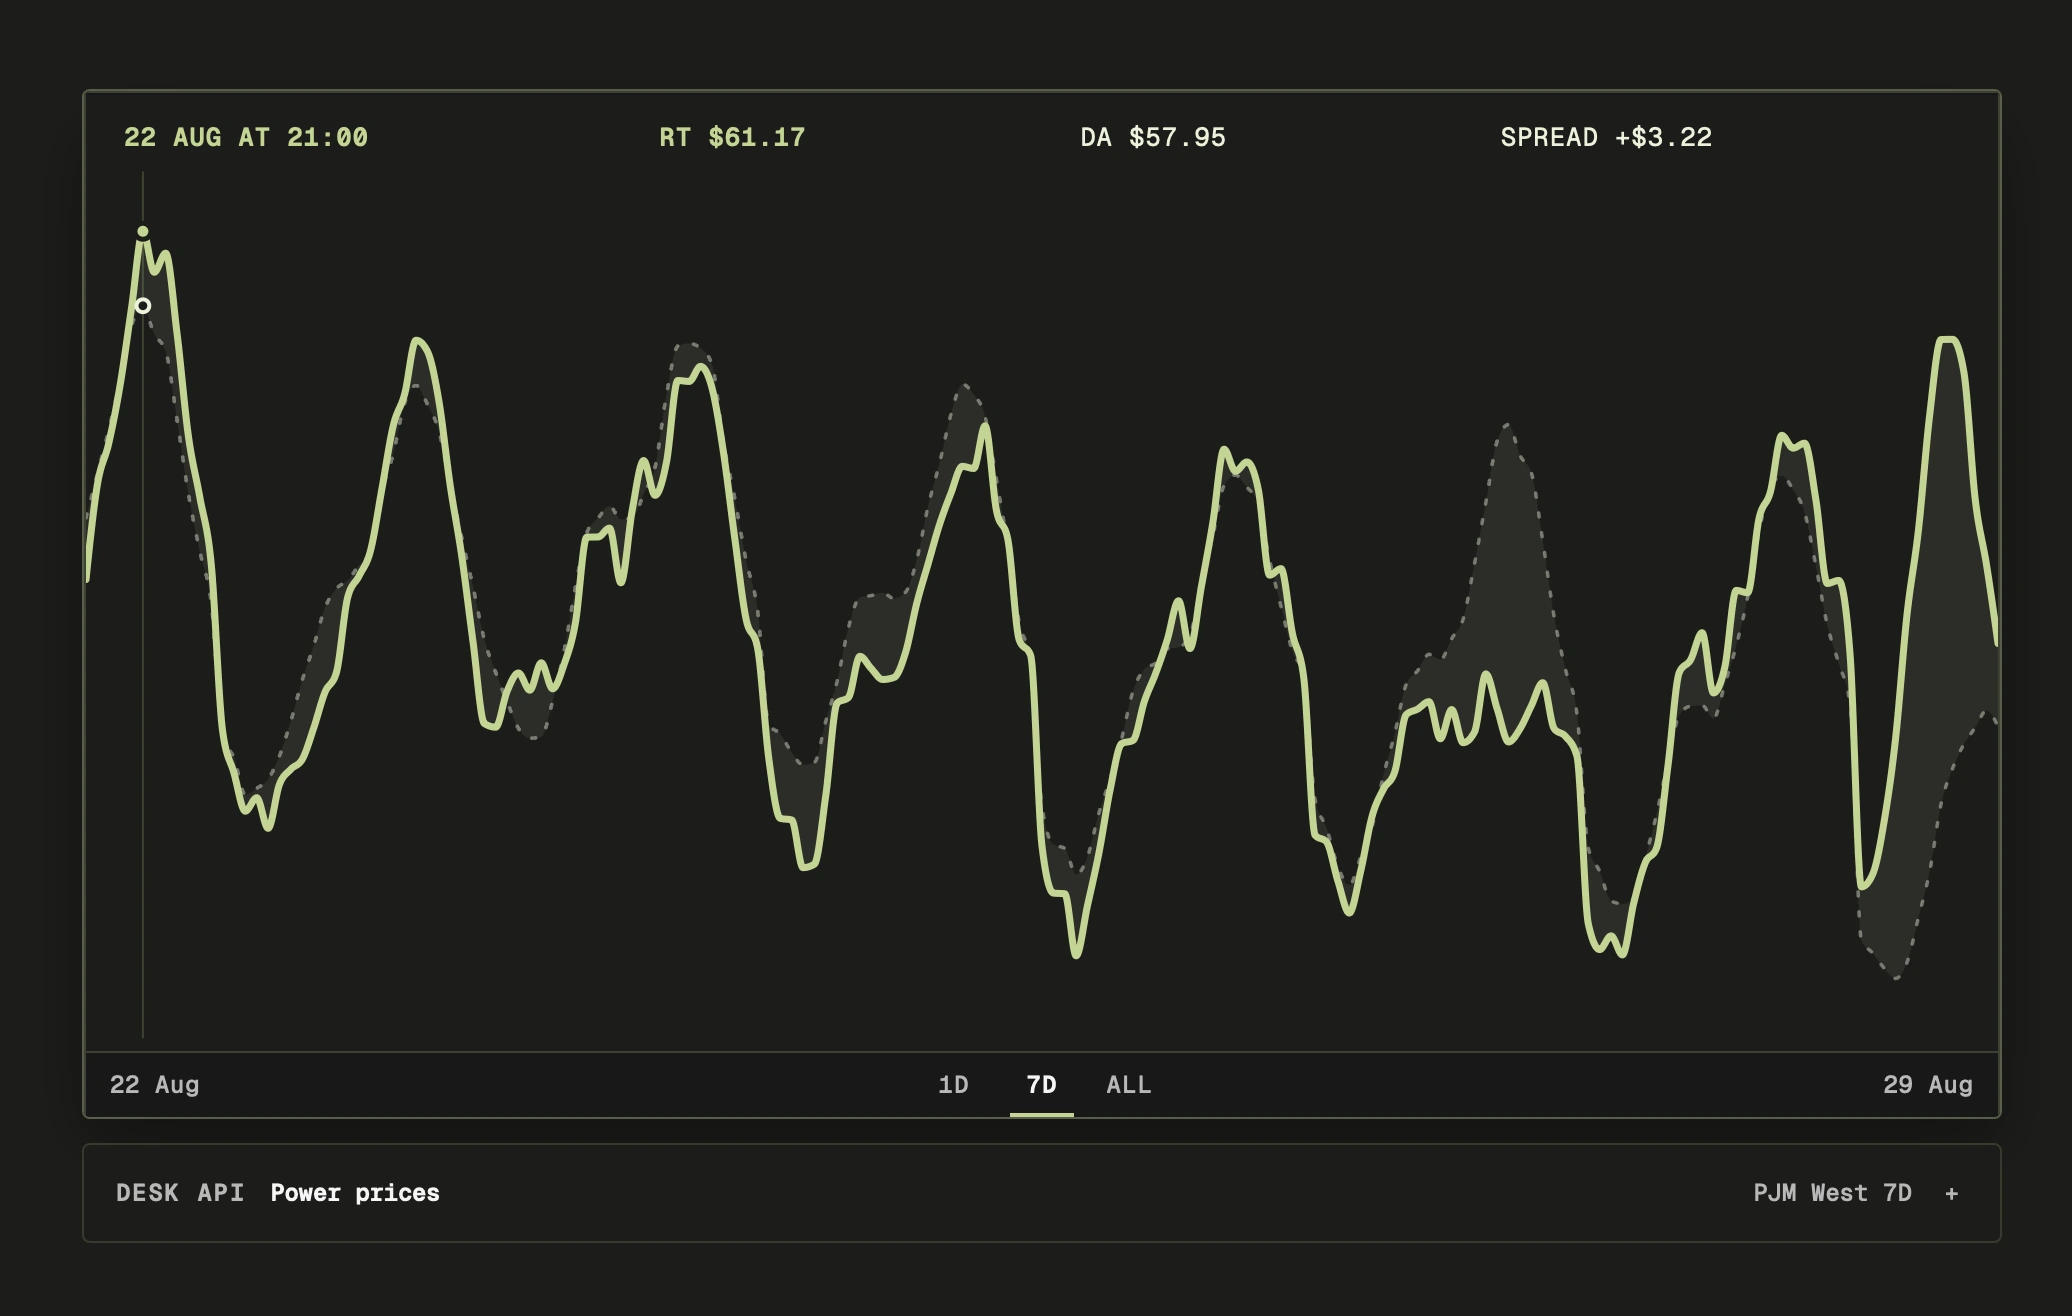
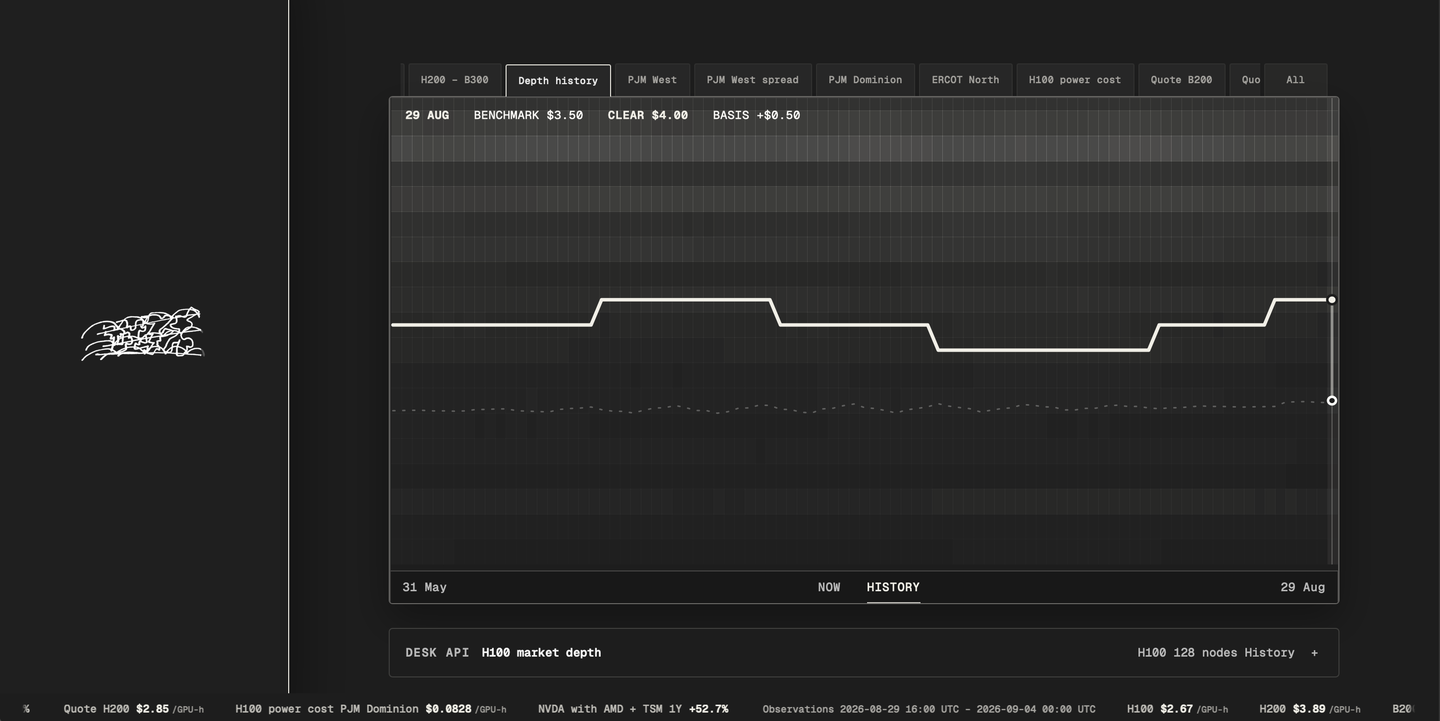
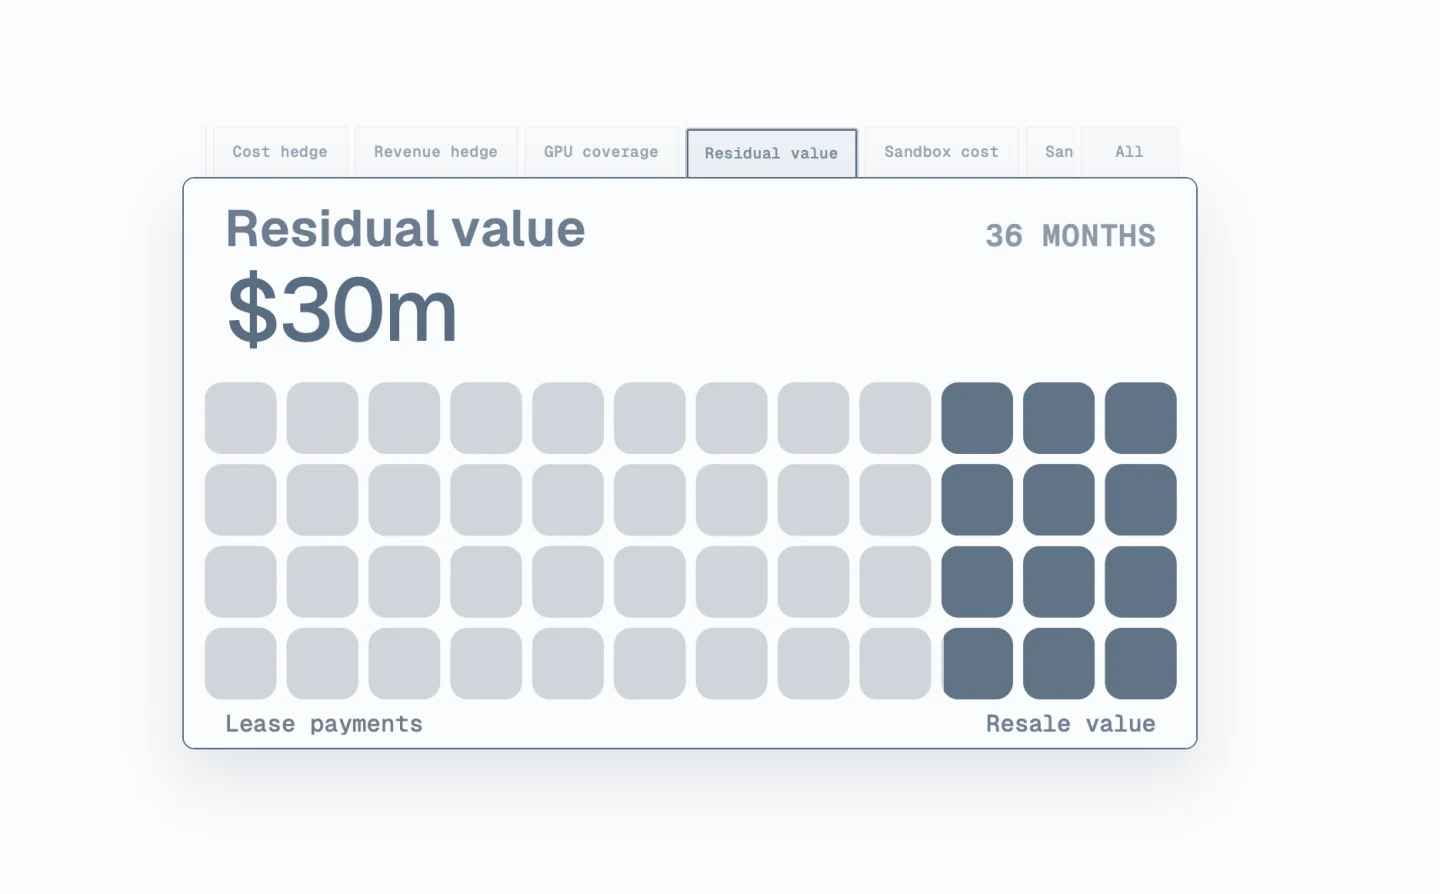
Compose the information relevant to your work: GPU prices, available capacity, power costs or your own deals. Create views, organize them into catalogs and share them with your team.
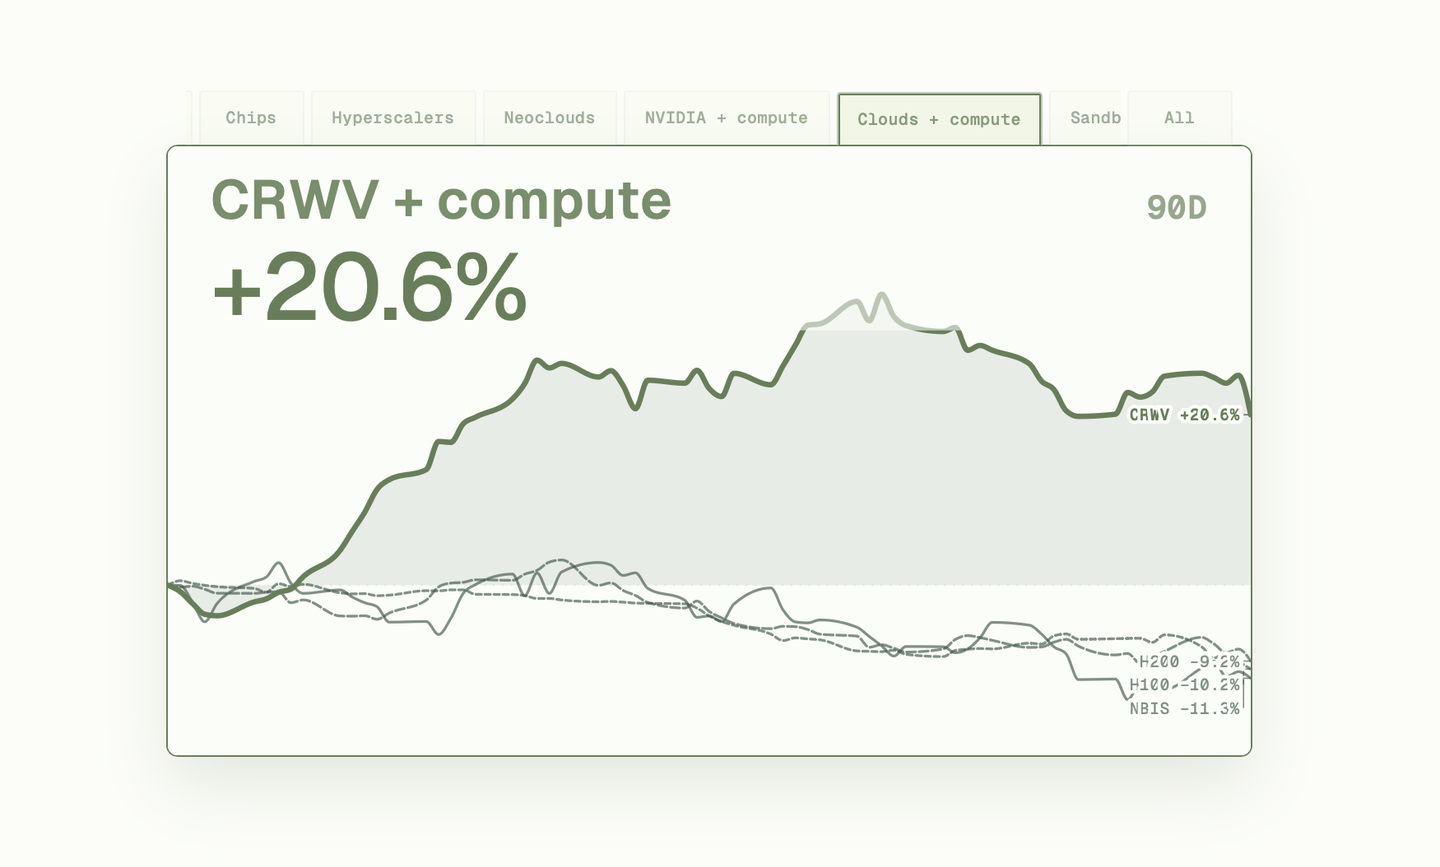
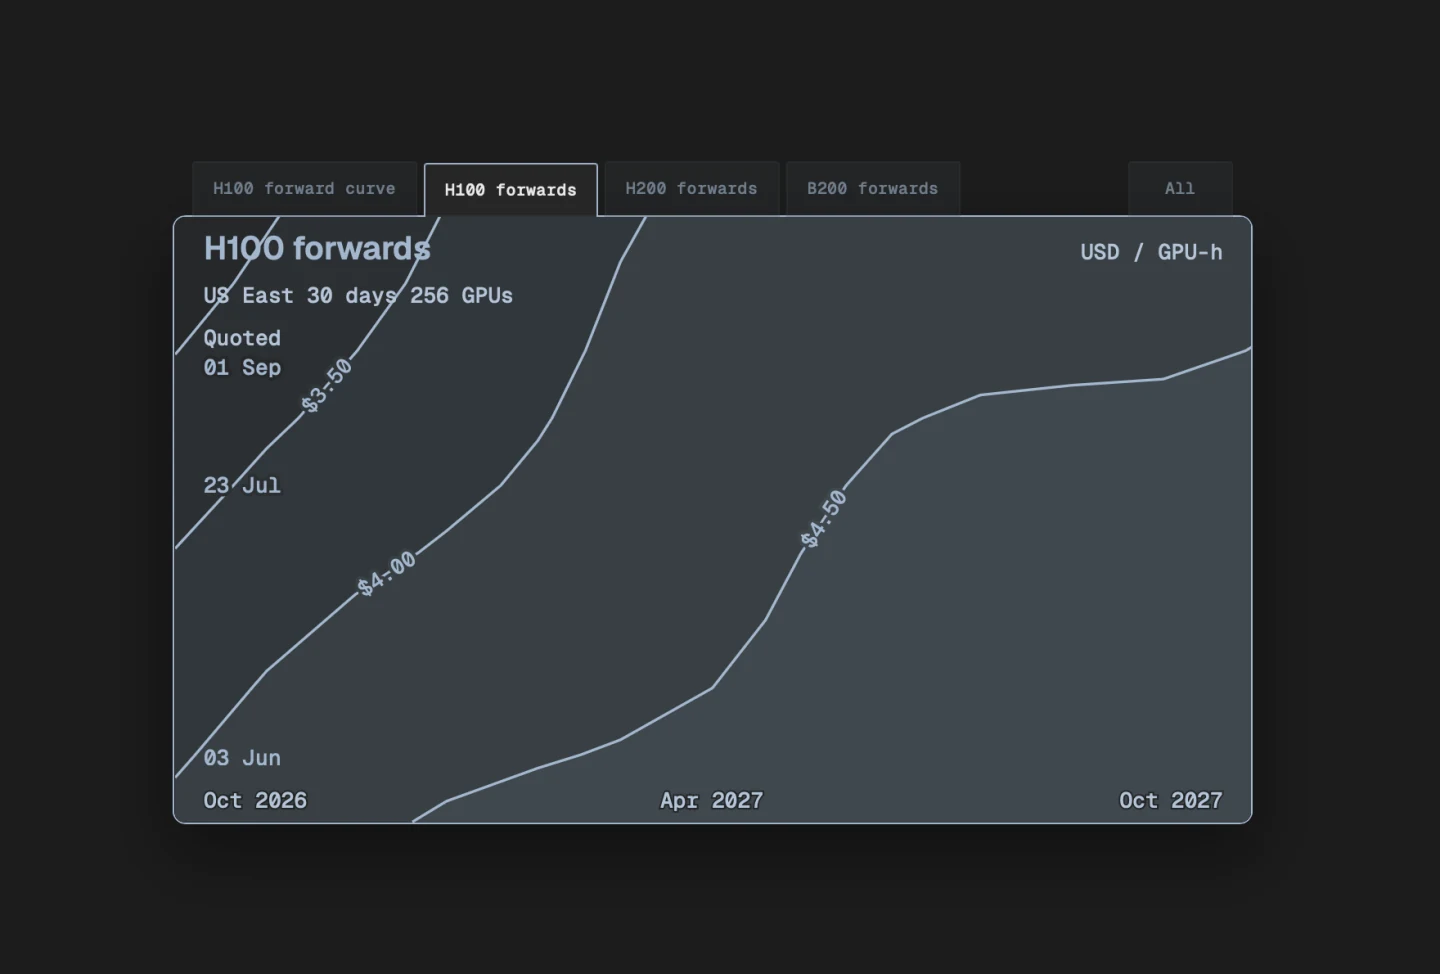
A view should be easy to read on its own. Details should hold the source, methodology and date, so someone opening a shared chart can understand what the number means.
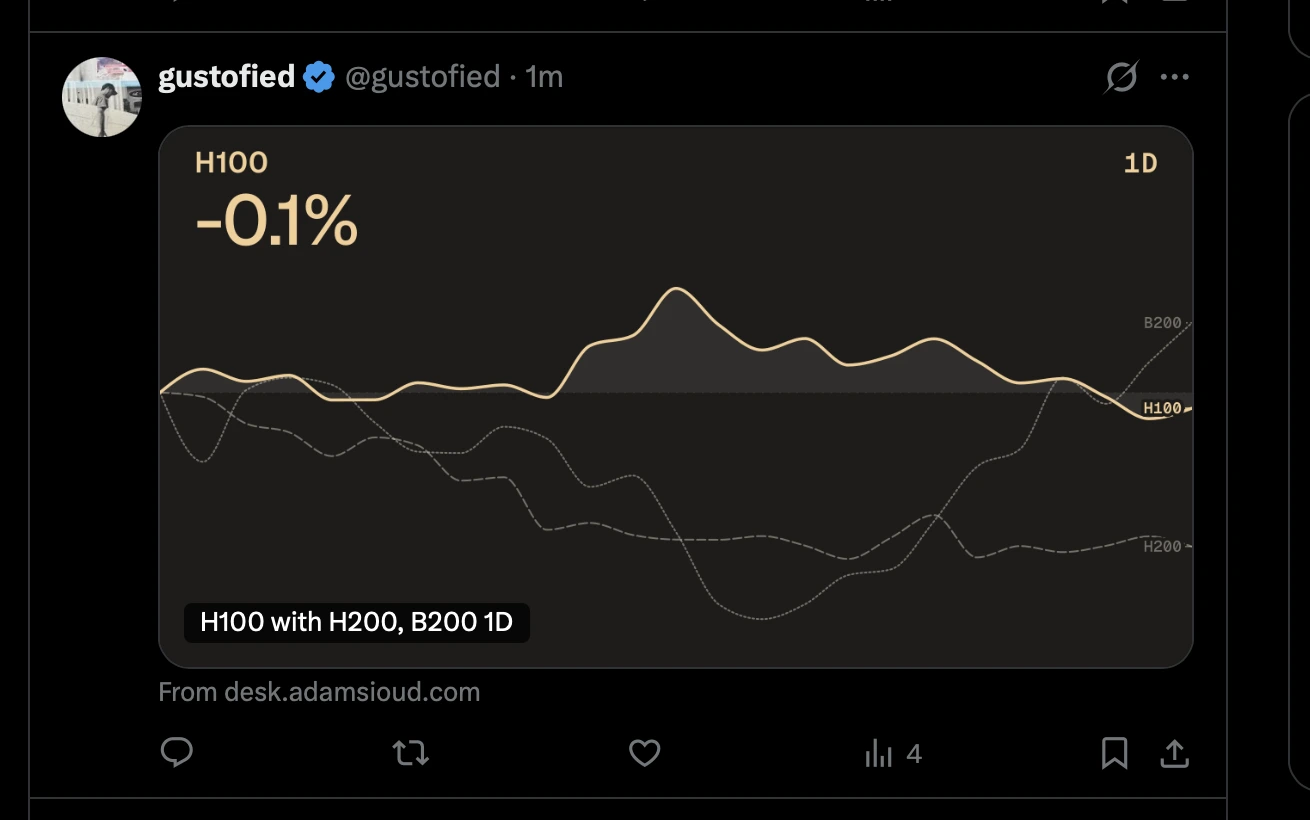
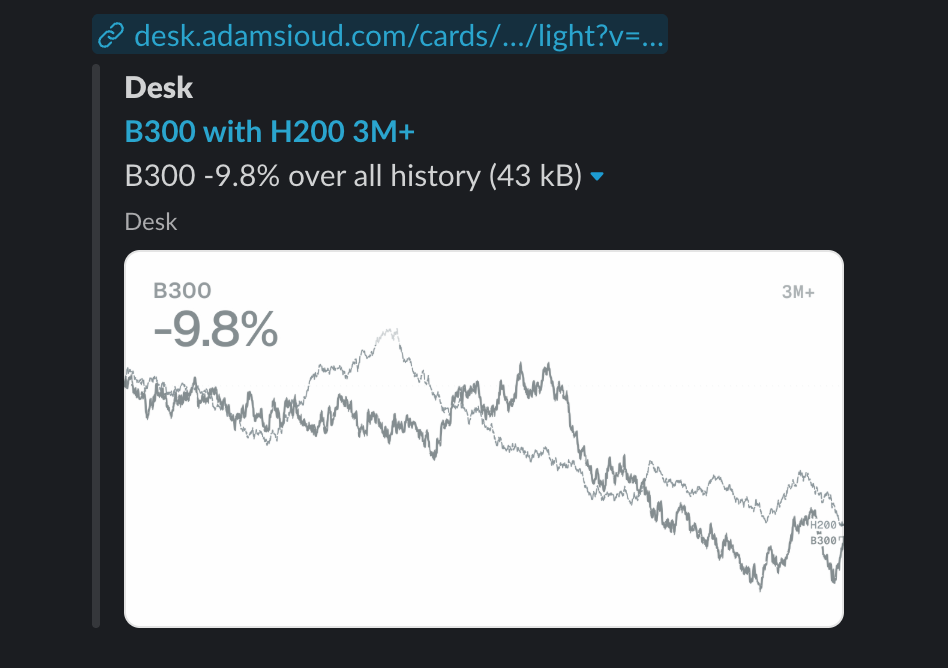
I want compute market data to have a recognizable visual language. Whether a view appears in Desk or in a conversation, it should carry enough context to be useful. The interface stays simple while the research behind it can be as detailed as the question requires.
Desk is built with D3.js. It follows the idea of composing useful pieces described in Mitchell Hashimoto’s The Building Block Economy.
From research to a shared view
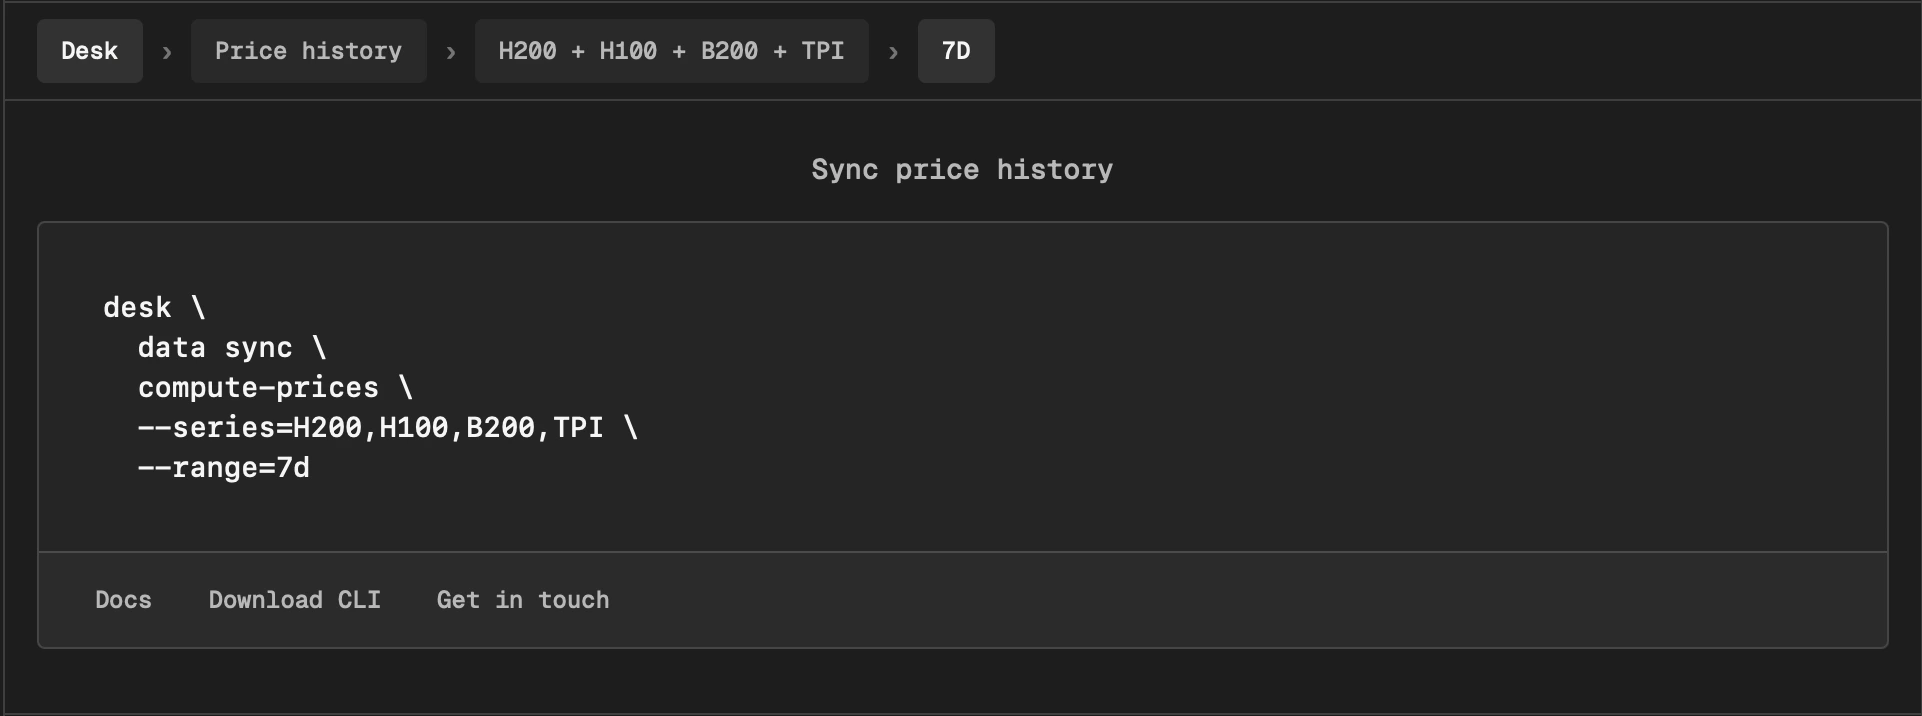
Start with a hypothesis, do some data wrangling and develop a model in a notebook. Test its assumptions and examine the results. Once ready, the model can run in the backend, with results shared as a Desk view and updated as new data arrives.
The studies on GPU rental prices and energy monitoring in buildings are early examples of this approach. One examines how price increases spread across sellers; the other looks at changes in energy use and what might explain them.
In future, I want to connect both studies fully to Desk and show the process end to end, from the initial hypothesis to a working view that people can use, follow and share.